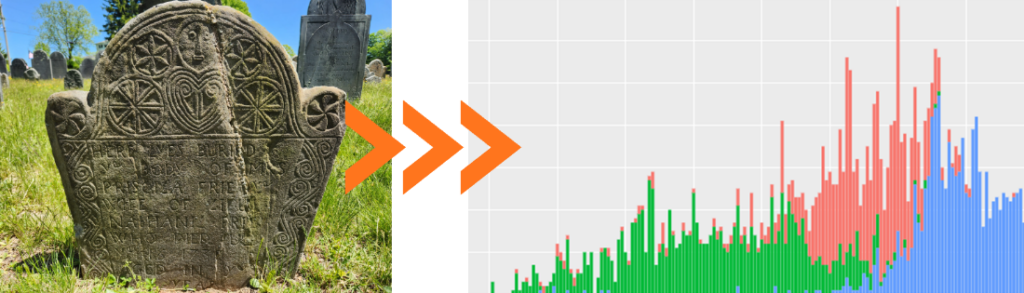
Burial Plots to ggplot
In the summer of 2022, I visited the Massachusetts Historical Society to conduct dissertation research. The following summer, I returned to Massachusetts with funding from the New England Regional Fellowship Consortium to visit several more archives, including Harvard Divinity School Library, The Phillips Library, The Congregational Library, and a return to MHS. On both these trips, I used spare time to visit 127 cemeteries in Massachusetts, New Hampshire, and Maine. This series of blog posts will tie some of my findings to the subject of my dissertation project- disability and religion in early America- while discussing how data and digital methods helps to study the topic. Part 1 will focus on the methodology, Part 2 will look at some early data findings, Part 3 will cover the disability history carved into New England’s gravestones, and Part 4 will tie all these parts together with the Salem Witch Trials. This series will hopefully turn into Chapter 2 of my dissertation project, Embodied Providence in Early America.
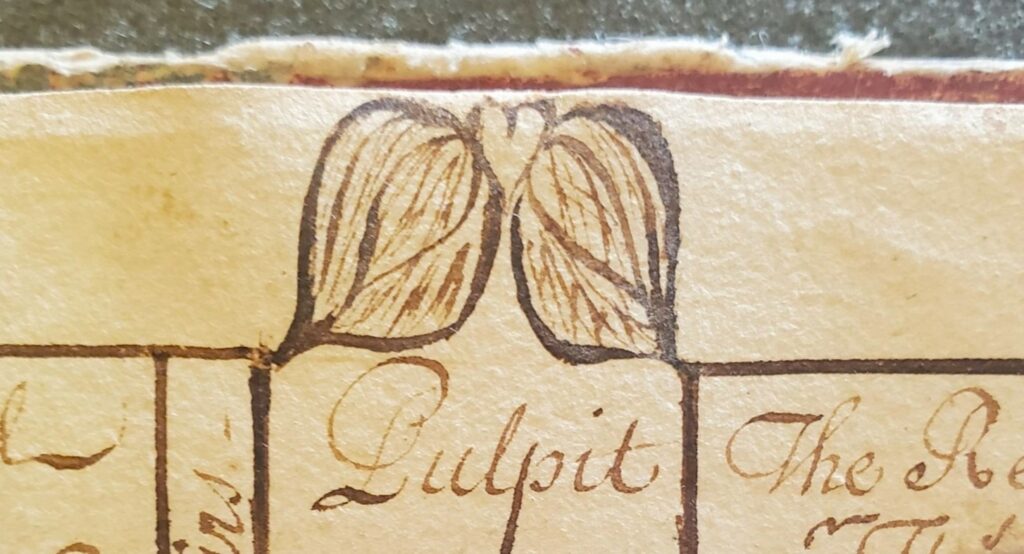

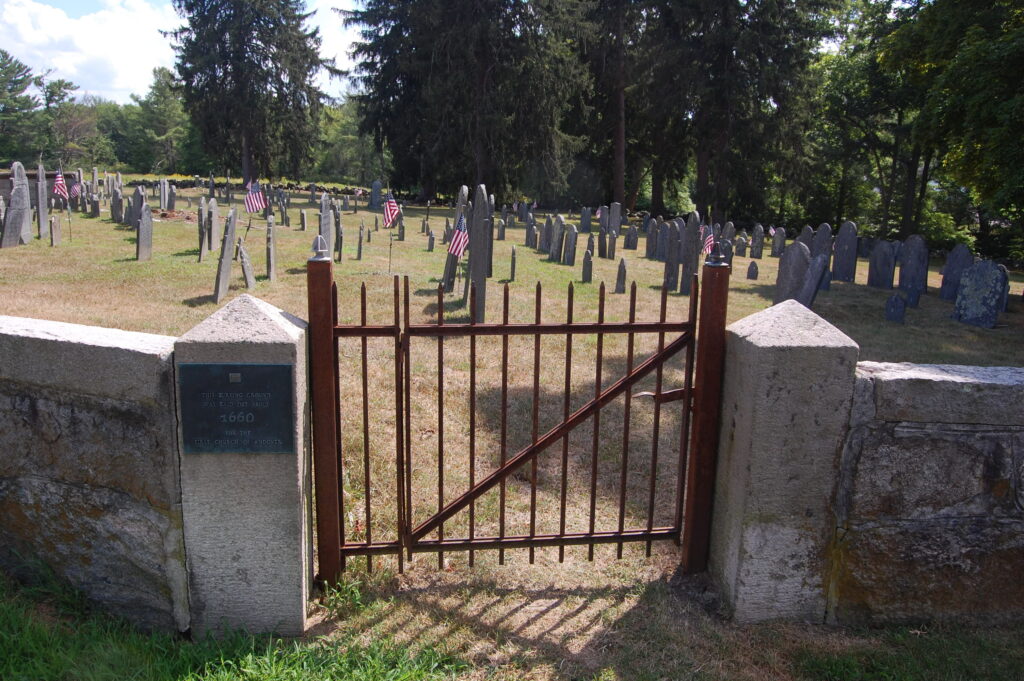
On my first visit to Mass Historical, I looked at the First Church of Boston records which included the Proprietors account book, 1711-1782. It included a pew map for the new brick meetinghouse from 1715 and above the pulpit sits a winged heart. I’ll discuss more about hearts in Part 3, but this imagery matters for my topic. It reminded me of the death’s head motif on early gravestones where a skull sits between two wings. On the next weekend, I walked from my parents’ house to North Andover’s First Parish Burial Ground and saw the potential for disability history sources in both the imagery and epitaphs. I visited 40 cemeteries that summer and 87 more the next. I did not intend to turn this into a data driven project, but as I processed the pictures, I started thinking about the possibilities and formalized the process.
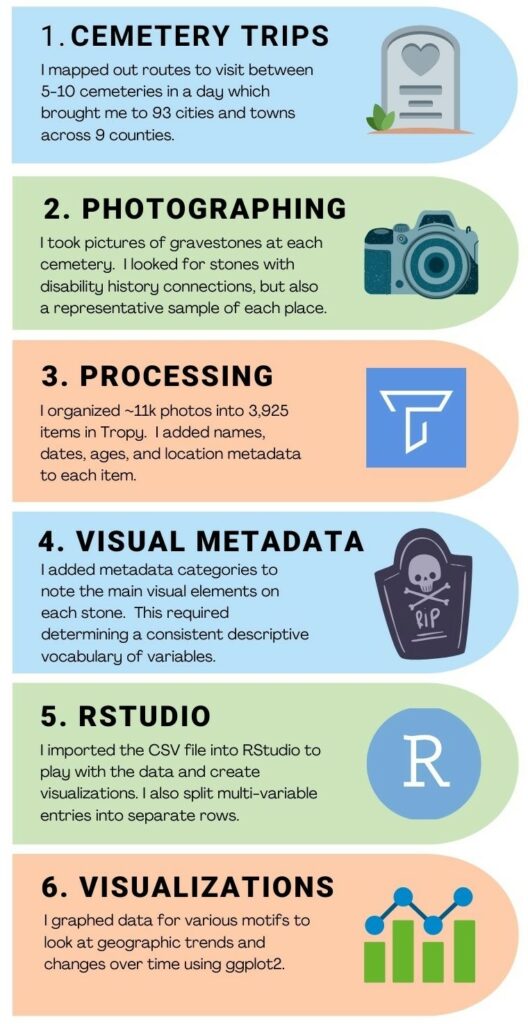
1. Cemetery Trips
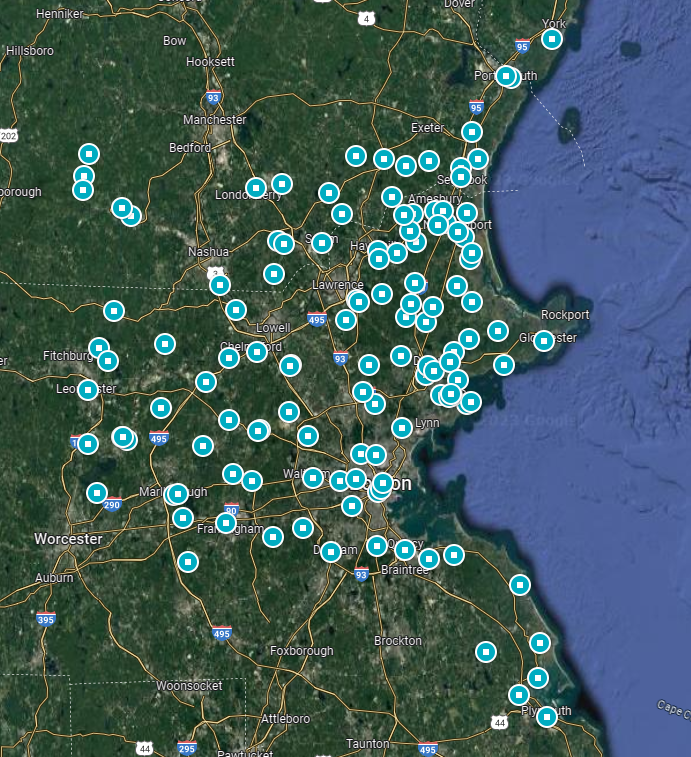
I scouted cemeteries online through Find a Grave and Google Maps street view to look for cemeteries within my time period, the 1660s to 1820s. I organized routes to visit 5 to 10 cemeteries in a day to cover northern Massachusetts before expanding south to Plymouth, west towards Worcester and across southern New Hampshire, and on a trip with my high school friends I dragged everyone to Old Parish Cemetery in York, Maine.
In future trips up to Massachusetts, I hope to add more cemeteries around Worcester, MA; Manchester, NH; and southern Massachusetts. I also intend to add some Boston area ones such as Dorchester and Charlestown. In the meantime, I’m considering how to use the Farber Gravestone Collection to supplement my data.
2. Photographing
At each cemetery I walked through each row of stones to look for possible connections to disability history (see part 3), representative samples of carvings as well as unique stones, and family names related to the Salem Witch Trials (see part 4). In the future, I hope to revisit some of the cemeteries to double check my initial sampling, expand the dataset, and see what new observations stand out on a second walkthrough. I used my twelve-year-old Nikon D40 to take a couple pictures of each stone. Ultimately, I took about 11,000 photographs of 3,925 stones. The Nikon’s shutter jammed during my last week and I resorted to using my cell phone.
There were challenges with reading gravestones: many are eroded or covered in moss and therefore illegible. Other stones are partially buried or in overgrown fields. I also struggled to photograph stones against extremely persistent swarms of mosquitoes at Lancaster’s Old Burial Ground and rushed through Newburyport’s Sawyer Hill Burial Ground given the foxes running around cemetery. Still, I tried to photograph a reasonable sample even if I decided to skip stones with little hope of deciphering (or that wildlife wanted me to avoid).
As for tech challenges, these photographs require 21.5GB of storage on my laptop. I did not organize the photographs in a helpful way, so I suggest being more cautious at the start of a project. All the JPEG files are located in folders based on the date of the cemetery trip rather than separate folders for the cemetery locations. The latter would make more sense than “Cemeteries May 27th”. I’ll fix this some day …maybe.
3. Processing
Once I saved all the pictures on my laptop, I loaded them into Tropy, a photo management software designed for researchers. I added my pictures into a designated project for gravestones. Since I took multiple photos of stones, I first went through and grouped photos into items. After that sorting, I added the self-evident metadata for each stone: Name, Death Date, Age, Cemetery, and Town.
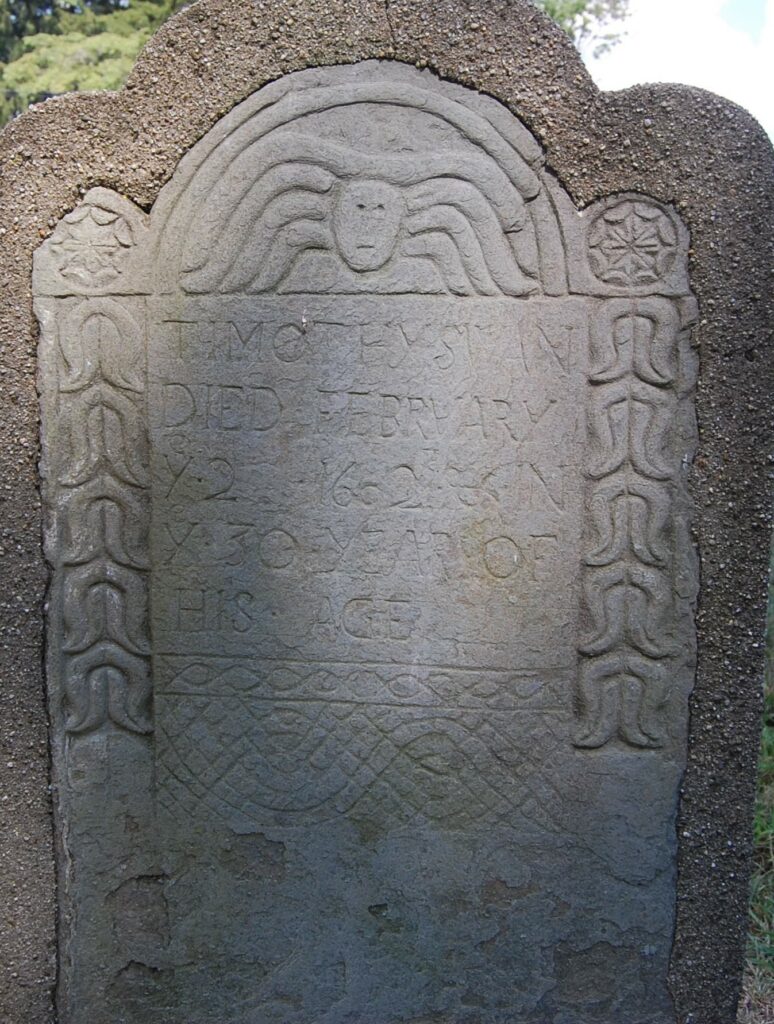
Death date and age posed a few questions. Gravestones exist for multiple people, often family stones representing decades. I used the most recent date given that a carver in 1780 could not inscribe a stone to a person who died in 1800. There are backdated stones, however. For example, John Hartshorne carved Timothy Swan’s stone that is dated 1692, but Hartshorne began carving after 1700. It will result in some outlier datapoints, but for the scope of this project, few stones are so wildly anachronistic to harm the overall findings. Those outliers when closer examined may also reveal unique information about gravestone carvers through their efforts, or lack of efforts, to match the imagery and the time periods. I am also less concerned about the integrity of the data from retro-dated stones that were contemporary to the life of the carver: Hartshorne’s first wife, Ruth, was Swan’s sister. Few retro-dated stones are generations removed from the deceased listed and the carving date.
In a different question, stones representing multiple people were marked for each age. If a stone represented a husband and wife aged 75 and 80 respectively but they died 10 years apart, the commission and/or purchase of the stone (and therefore its imagery) were still for a 75-year-old and an 80 year old. The ages are all accounted for, albeit both dated for the latest death year.
This distinct treatments for age and death year matter for the value of the dataset. The data is not an accurate portrayal of lifespans. If I wanted to trace lifespans on gravestones, I could organize a metadata system in that manner, but it is not in the scope or interest of the project. The visual data such as skulls an cherubs, the approximate year of the carving based on death date, and age of the deceased honored with those images are within the scope of my project. As I analyze various facets of the data, backdated stones, whether purchased later by circumstance or to replace an earlier memorial, will remain in consideration. This makes the dataset valuable for understanding funerary art over time, not colonial American demographics.
4. Visual Metadata
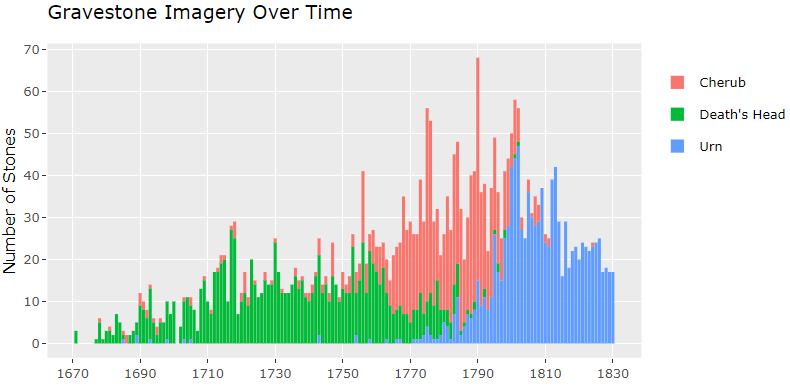
The metadata vocabulary for the artistic elements of the stones posed more problems than the death and age questions. New England gravestone imagery is often divided into the categories of Death’s Head, Cherub, and Urns as the 3 main motifs that appear. However, soul effigies, hourglasses, abstract designs, coffins, floral patterns, and more adorn dozens of stones, and often times these images appeared together like a winged hourglass over a cherub or a death’s head flying over a heart.
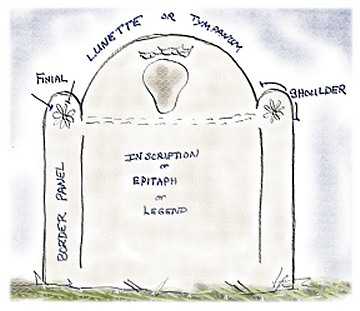
I initially decided how to focus on the relevant imagery. The tympanum, or the top crest of the stone, features the main feature of the gravestone’s design. The skulls, angels, and urns appear here. The finials on the shoulders, the rounded sides next to the tympanum, often featured secondary designs like faces, miniature cherubs, and abstract patterns. (See this diagram by the Connecticut Gravestone Network.) Carvers might also adorn stones with floral and vegetative carvings for additional decoration along the borders. I chose to focus on the featured designs, meaning the main imagery in the tympanum and finials. Data is messy and case by case decisions were necessary on occasion.
Given my focus for this project is representations of bodies and souls, I made decisions to look at the relevant motifs. Otherwise the number of flowers tagged might overwhelm the dataset when these carvings are mostly decorative compared to the theological themes of my dissertation. Other historians might find meaning in the floral patterns and chose to create that dataset, but I needed to limit the scope of the project somewhere, and these tympanum and finial carvings are the visual focal points for gravestone viewers.
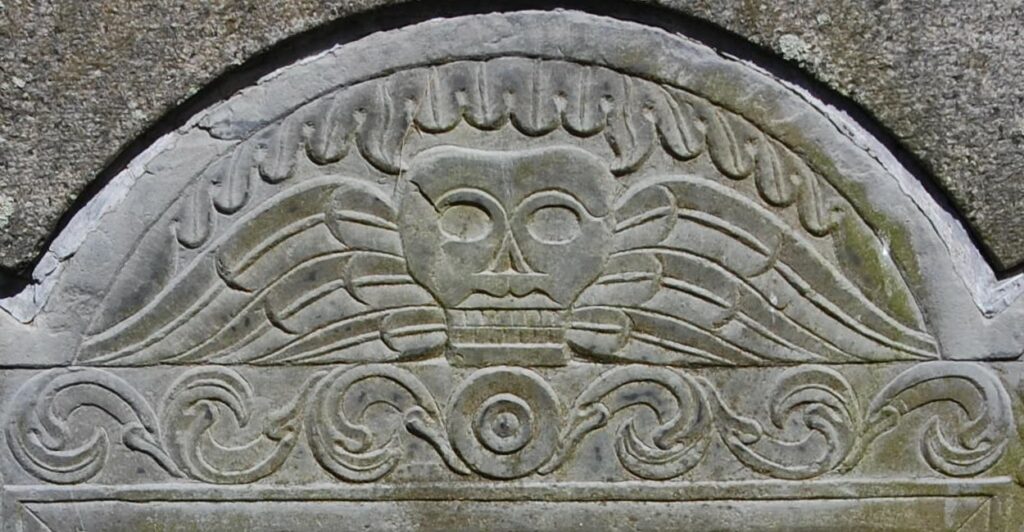
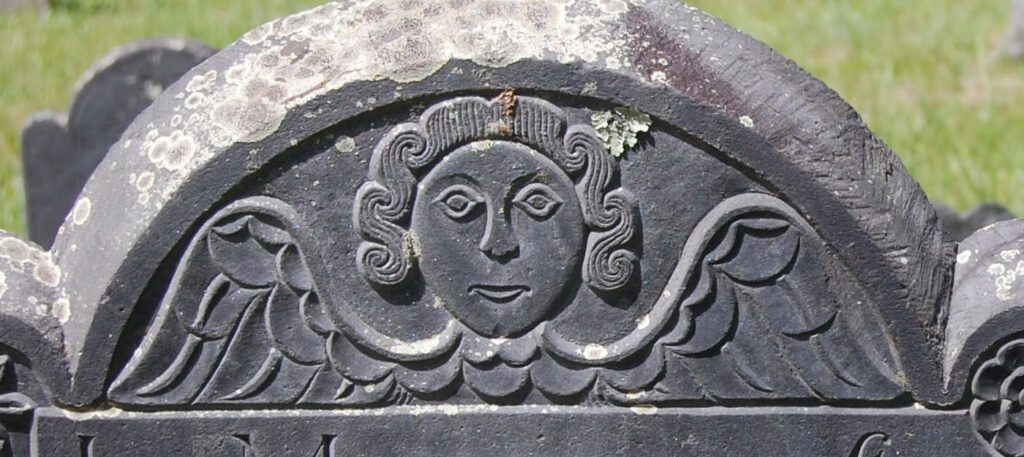
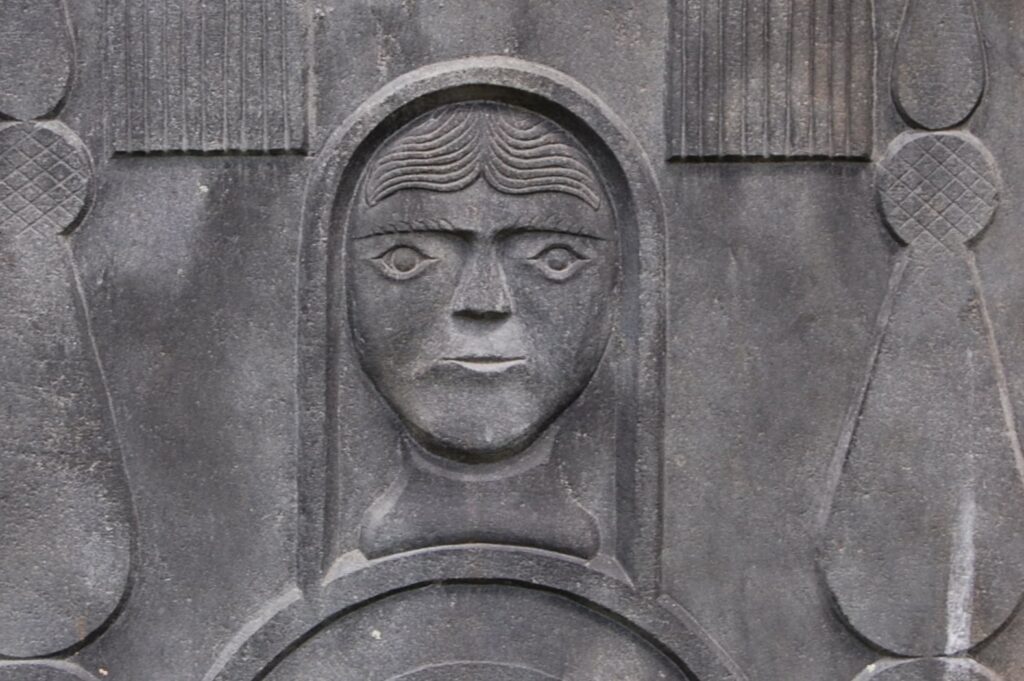
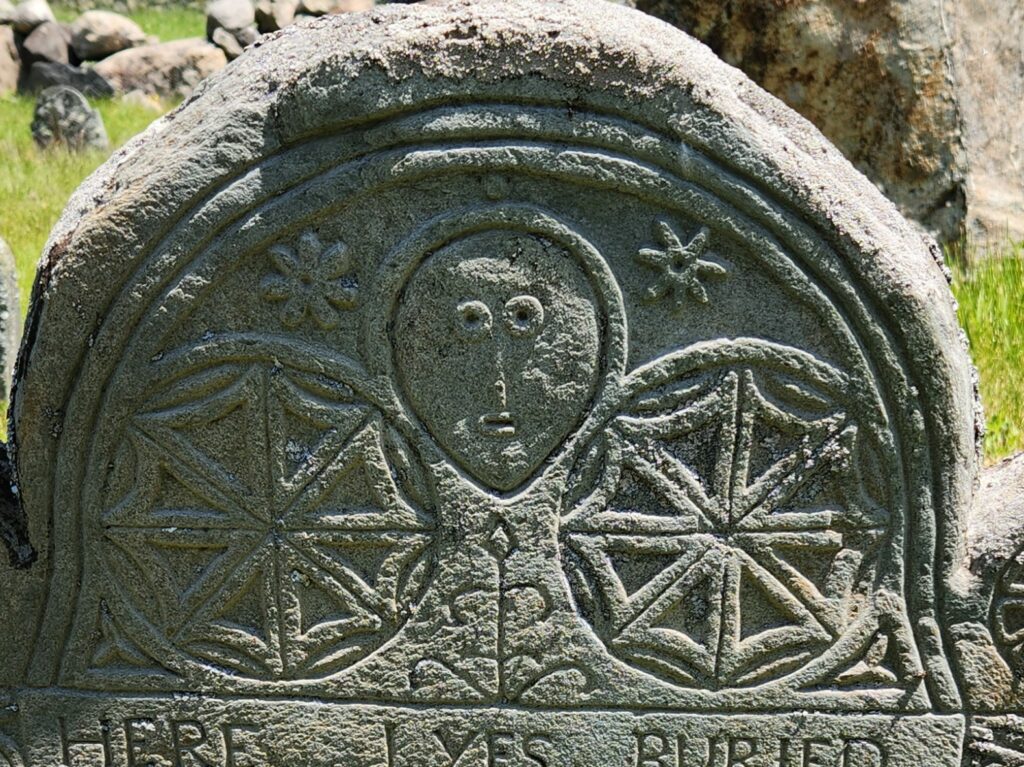
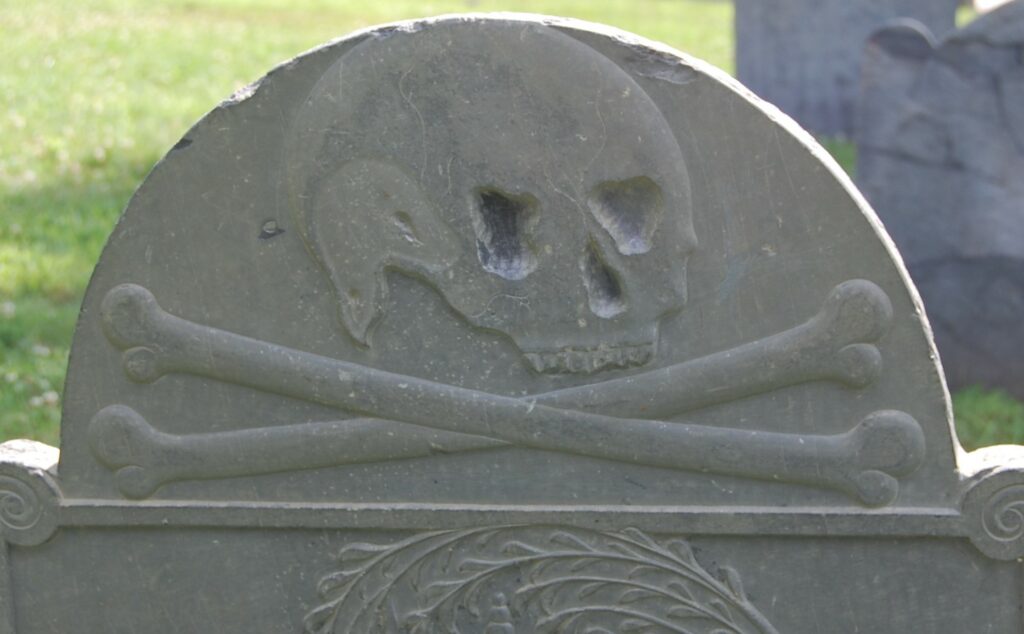
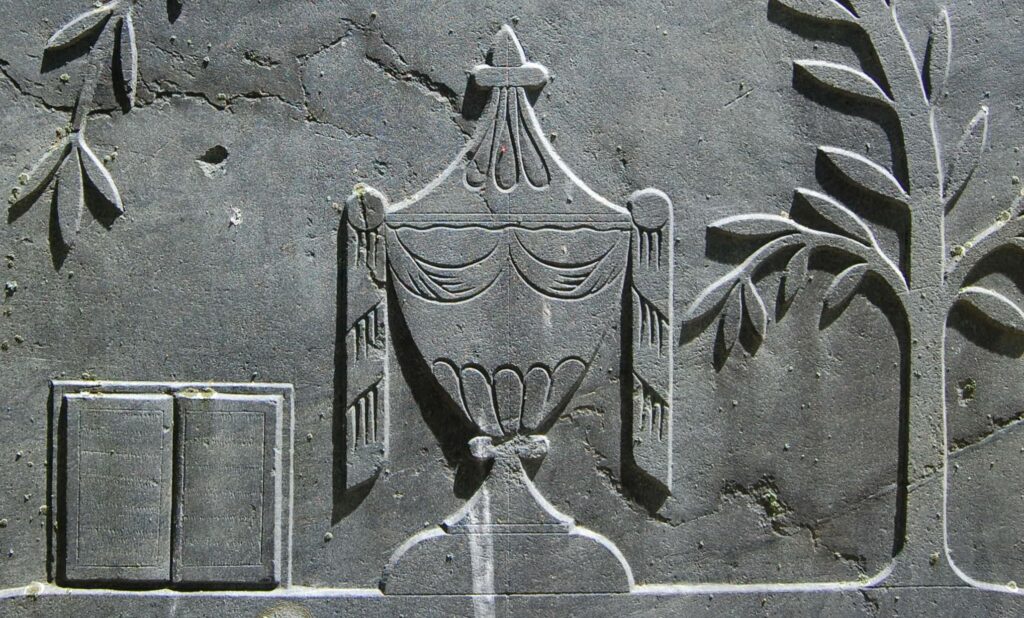
After determining the visual metadata scope, I began to determine the categories of visuals. Some of it was easy: its an urn, imagery is an urn; it’s a coffin, imagery is a coffin. Others brought up unusual questions: how fleshy does a face need to look to be a cherub rather than a death’s head? Is it a face or a soul effigy if it has shoulders? Do skull require teeth? Ultimately, I expanded the usual notion of death’s head, cherub, and urn to include effigy and face as prominent motifs and compared carvings to each genre to place tricky cases. In total, I assigned terms to 42 designs, ranging from singular appearances in the dataset to nearly 1,200 urns. I also added a secondary column for the motif to collect wider themes, such as coffins, skulls, and death’s heads as Death which are otherwise separate imagery categories.
5. RStudio
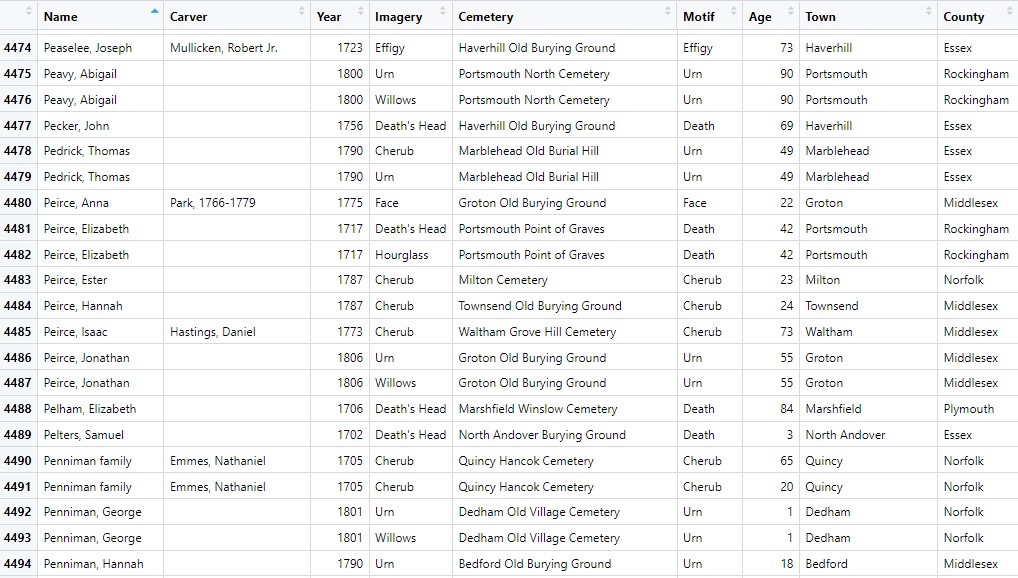
I exported the metadata from Tropy into a CSV file and loaded it into RStudio to start analysis. Columns like age and imagery included lists of variables inside single cells. R assumes that data within a cell is a single variable. I used the command separate_rows to split these into multiple rows of data with a single variable. This left me with 6,574 observations of 10 variables for my 3,925 gravestones.
I spent some time cleaning up the data by finding errant commas, mistyped imagery labels, and other typos. I fixed these in Tropy and re-exported it.
6. Visualizations
With all the data created, organized, and tidied, I began to visualize it with ggplot2. Here is one example plot, and more on how data visualizations provide insight into the gravestones and the religious culture of the period will be discussed in Part 2 (coming soon!).
What’s Next?
I plan to keep adding gravestones as I go home to New England and find time to visit more cemeteries and revisit others.
I also need to think about the text data gathered on the stones. I tagged the epitaphs and verses written underneath the inscriptions, and hopefully can build a dataset out of these someday. However, this section of the stones is often buried, covered by long grass, and simply unreadable now. There is still a sizeable sample to work with, but creating a clean dataset will take more work than my dissertation allows at this time.
Bibliography
Deetz, James, In Small Things Forgotten: An Archeology of Early American Life
Forbes, Harriette Merrifield, Gravestones of Early New England and the Men Who Made Them, 1653-1800
Ludgwig, Allan, Graven Images: New England Stonecarving and Its Symbols, 1650-1815